Bring Digital Analytics to Life with Data Visualizations
Published by Spinutech on November 13, 2020

The Value of Data Visualization
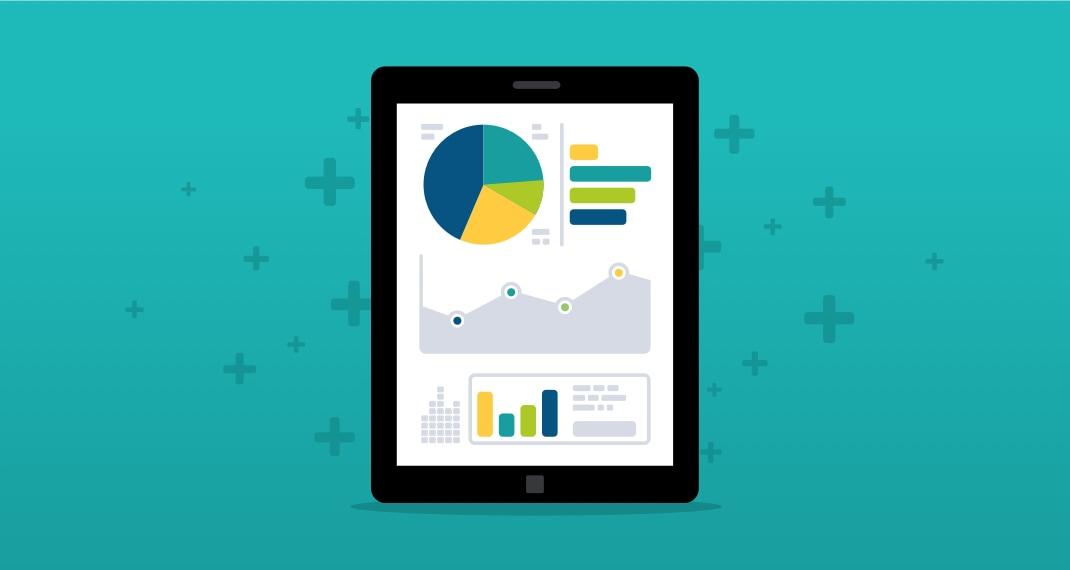
The concept of data visualization is truly the intersection of metrics and design. Giving your data a visual representation through the use of graphs, charts, or maps makes the concepts easier for people of all experience levels to understand while making trends or outliers easier to spot.
The science behind data visualization is simple: human eyes are drawn to graphical elements. Visual components have long been used in traditional and digital marketing to speak to an audience and outline a marketing message more successfully — whether digital or traditional. Graphics, photos, or icons grab attention and engage the consumer, both online and on the page. And the same concepts apply to data. Adding in visual elements and bright colors breathes life into your otherwise mundane raw data by combining metrics with unique design to create great storytelling.
5 Benefits of Data Visualization in Marketing
The benefits of graphical visualization for your data are clear, and the proliferation of big data increases the importance of translating your metrics into something that is digestible for all levels of your organization. Our analytics tools allow us to track more data and metrics than ever before, yet we still rely on human analysis to make sense of it all.
- More powerful analysis — graphical representations help make sense of complex concepts and identify emerging patterns that may otherwise have gone undetected.
- Faster interpretation — data visualization makes it easier and quicker to identify patterns and outliers. Our brains process visual queues much faster than written information.
- Contextual insights — provide context and meaning to numbers that would otherwise be presented in flat formats like spreadsheets.
- Trend prediction — analyzing patterns in a graphical form allows you to see the relationships between data sets and more easily predict pattern changes.
- Error identification — when outlier data exists, a visualization allows you to identify and course correct.
Making Data Digestible for Your Audience
One of the most important factors driving the trend toward data visualization is the ease of interpreting data in a visual format. You don’t need to understand statistics or have a background in data interpretation to understand information presented in a well designed format. This makes data accessible to people in all roles within an organization and therefore makes it easier to identify data-based decisions — from marketing strategies to facilities changes. With data visualization, complex concepts are translated into something that is easy to understand for almost anyone at any level of your business. Data visualization is a communication tool that can close the gap between analytical and critical thinkers.
4 Ways Data Visualization Can Help Marketers
Collecting and compiling data has been the focus of companies over the past several years, ever since the concept of big data became ubiquitous with successful marketing strategies. But once you have these data sets, what do you do with them? We already discussed that data visualization creates digestible information for a wide audience, but here are a few ideas on how the interpretation of this data through visualization can be used to influence marketing strategies.
Define Your Audience Through Segmentation and Persona Development
Data visualization can aid in the creation of audience personas, allowing a marketing team to get a better idea of who they are talking to. By combining your existing customer data and purchase behaviors, analytics insights, and customer feedback with industry research and interviews, you can better define your audience and segment your messaging to maximize effectiveness.
Predictive Analytics in Digital Marketing
Utilizing data visualization allows analysts to derive actionable insights more quickly than raw data formats. This enables analysts to create patterned outcomes and audiences to make informed hypotheses about the next step that audience will take. Predictive analytics helps marketers anticipate the needs of their audience and proactively provide resources and recommendations to further the user down their predetermined purchase funnel.
Trend Analysis and Prediction
Digital content marketing strategies rely on trend prediction and seasonality to hit the right audience at the right time. Data visualization makes interpreting and predicting these trends easier and more effective, so that you can publish in advance of their peak, giving time to capture the trend and capitalize on the uptick in popularity, growing the authority and reputation of your domain.
Storytelling for a Better Business Case
Integrating data visualization into your internal marketing plans can tell the story of your user journey and support your business case for recommended marketing strategies. Upward communication to decision makers within a business is leveled up when data is visually interpreted to make it easy to see why your recommendations are supported. Data based decisions are easier to prove as they are backed by metrics and easily tracked.